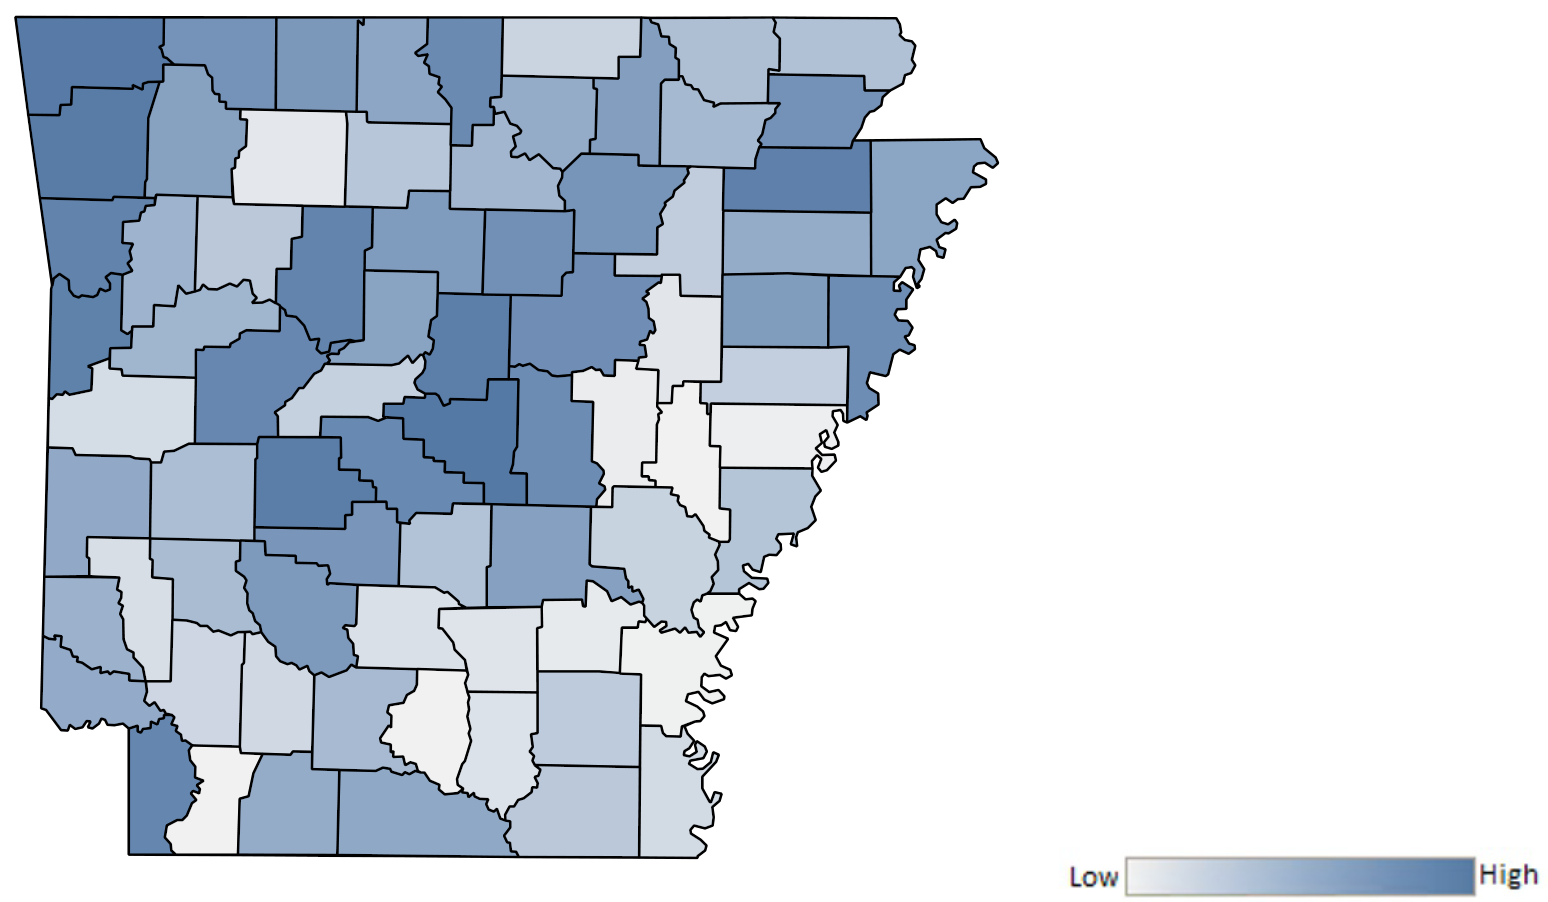
Complaints by County


Download county data [CSV, 1.7 KB]

Map of Arkansas counties indicating relative number of complaints from low to high. See attached CSV file for complaint data by jurisdiction.


Complaints by Topic*

Graph of Do Not Call complaints by topic in the current fiscal year. The topic with the most complaints was reducing debt with 6,175 complaints, followed by imposters with 3,174 complaints and medical and prescriptions with 2,558 complaints. Note: not everyone who files a complaint reports a topic.


State Totals

Complaints:42,865(#37 nationally, per 100K population)
Active Registrations:2,087,259(#37 nationally, per 100K population)


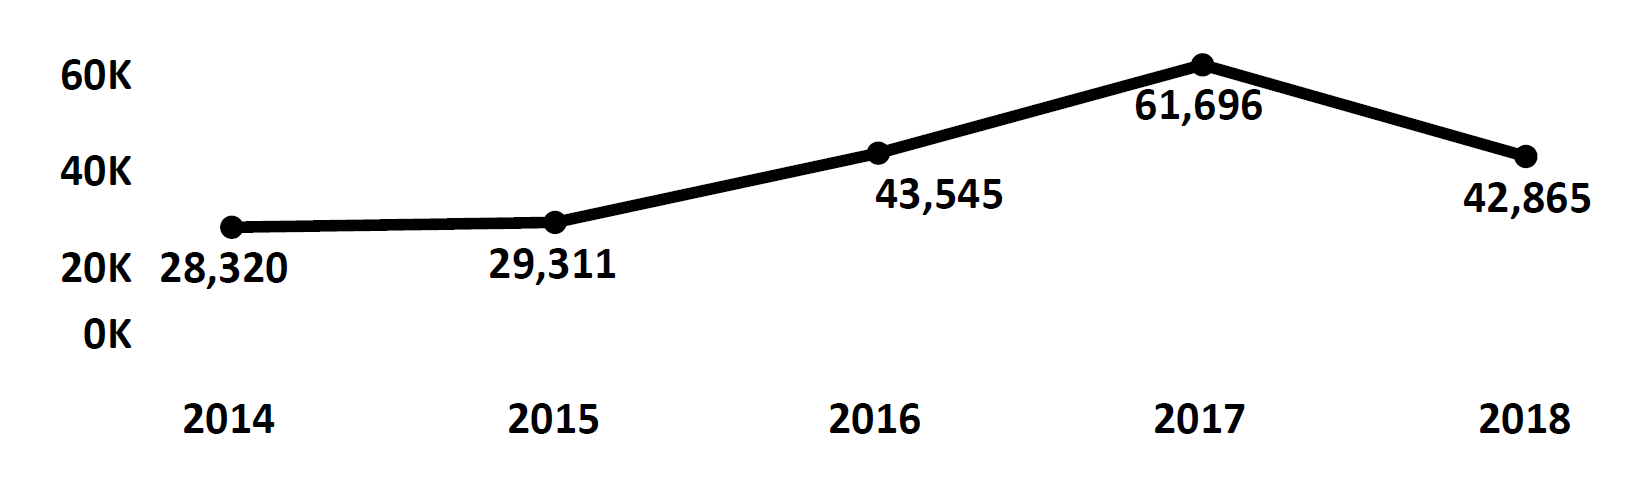
Complaints by Fiscal Year

Graph of Do Not Call complaints recorded in Arkansas from fiscal year 2014 to fiscal year 2018. In 2014 there were 28,320 complaints filed, which increased to peak at 61,696in 2017. In 2018 there were 42,865 complaints filed, fewer than 2017 and 2016.


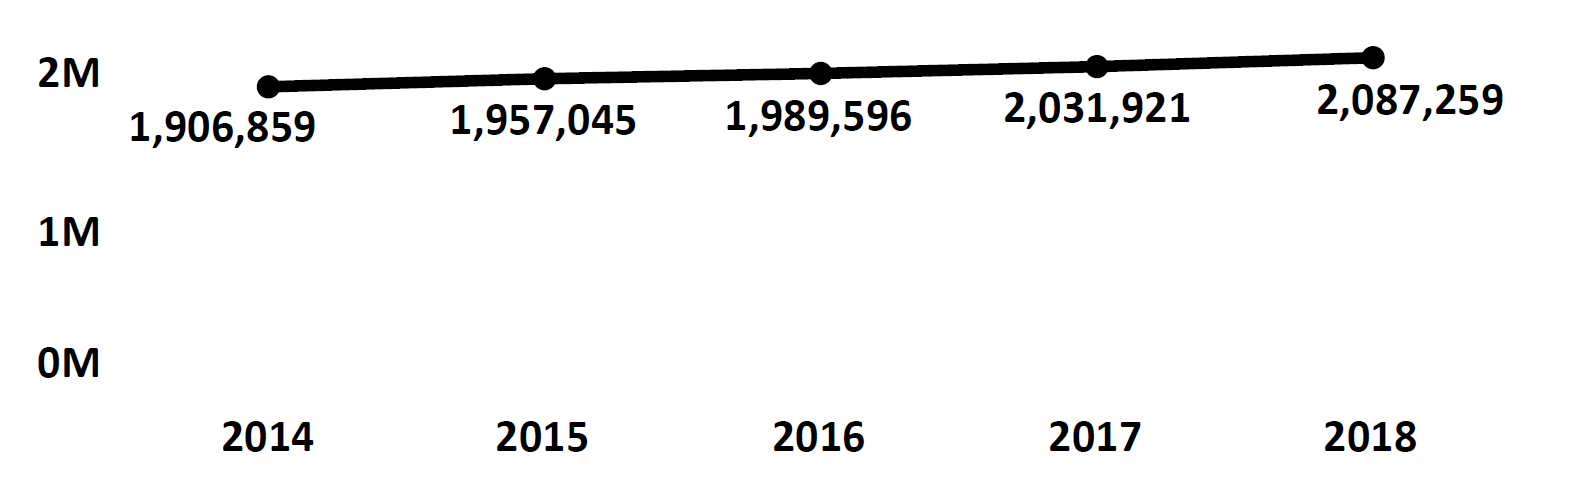
Active Registrations by Fiscal Year

Graph of active Do Not Call registrations in Arkansas each fiscal year from 2014 to 2018. In 2014 there were 1.9 million numbers registered, which increased steadily each year. In 2018 there were 2 million numbers registered.


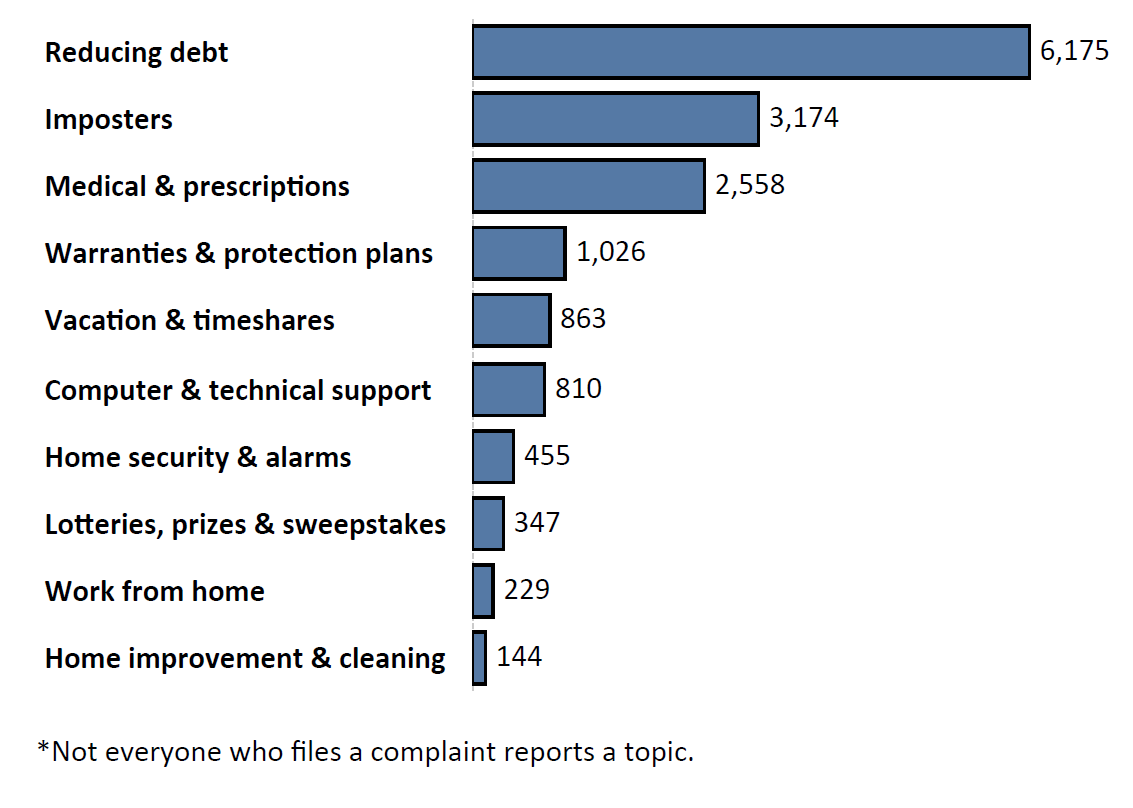
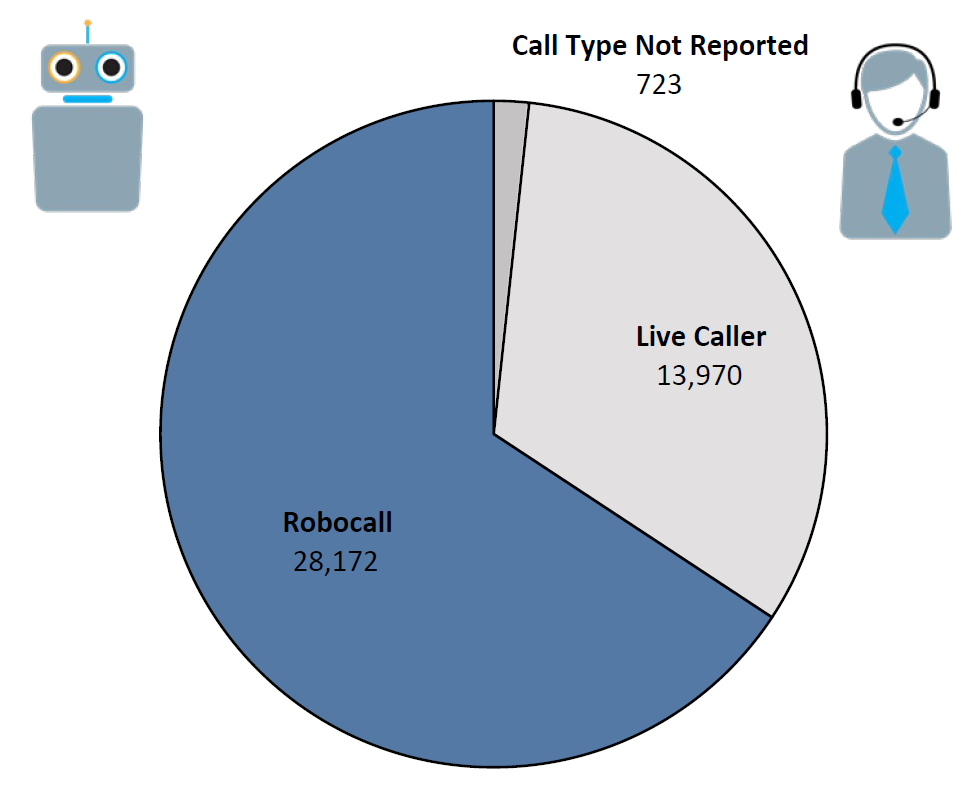
Complaints by Call Type

Pie chart of Do Not Call complaints by Call Type in the current fiscal year. The largest portion was robocall at 28,172, followed by live caller at 13,970, and call type not reported at 723.