
Top Ten Report Categories
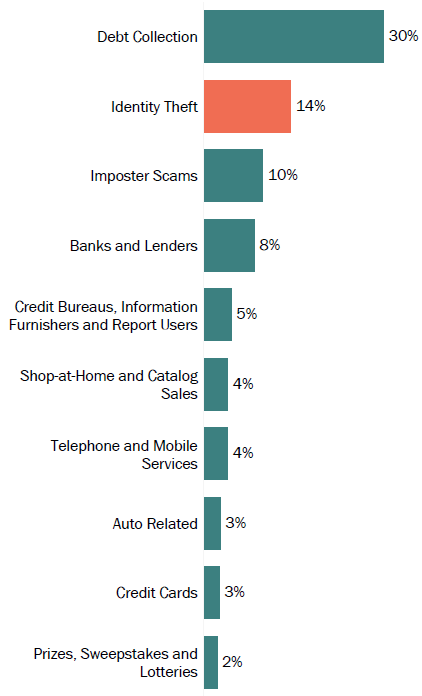
Fraud & Other Reports/Losses
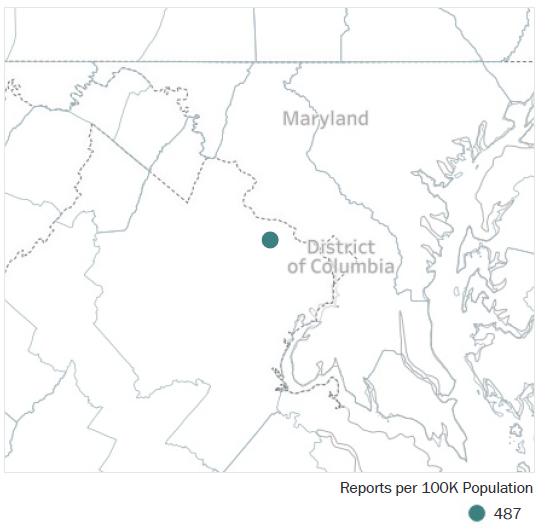
| State Rank (Reports per 100K Population) | N/A |
| Total Fraud & Other Reports | 7,916 |
| Total Fraud Losses | $2.5M |
| Median Fraud Loss | $309 |
Fraud & Other Reports By MSA
Download Metropolitan Statistical Area data [CSV, .55 KB]
Top Identity Theft Types
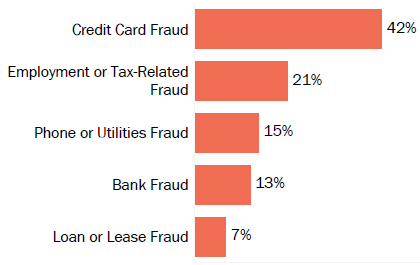
Identity Theft Reports
| State Rank (Reports per 100K Population) | N/A |
| Total Identity Theft Reports | 1,333 |
Percentages are based on the total number of relevant 2017 reports from District of Columbia consumers, as indicated in the chart title. Consumers can report multiple types of identity theft.