
Top Ten Report Categories
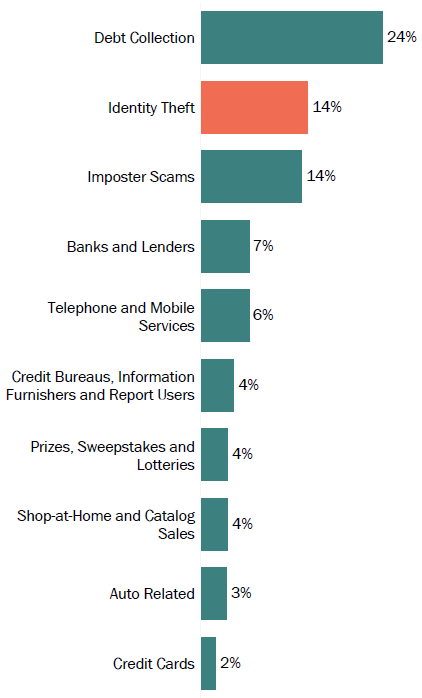
Fraud & Other Reports/Losses
| State Rank (Reports per 100K Population) | 3rd |
| Total Fraud & Other Reports | 23,071 |
| Total Fraud Losses | $7.7M |
| Median Fraud Loss | $500 |
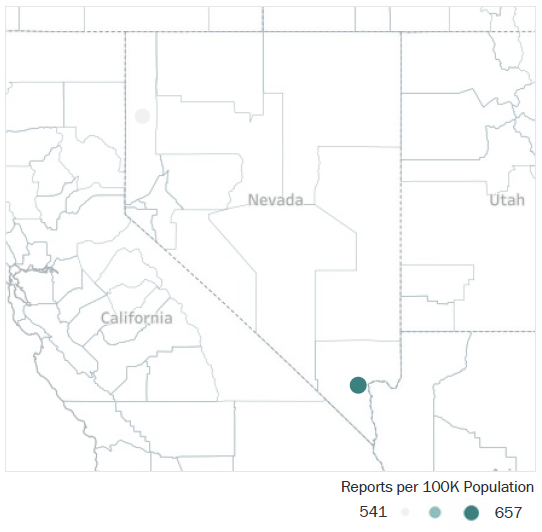
Fraud & Other Reports By MSA
Download Metropolitan Statistical Area data [CSV, .65 KB]
Top Identity Theft Types
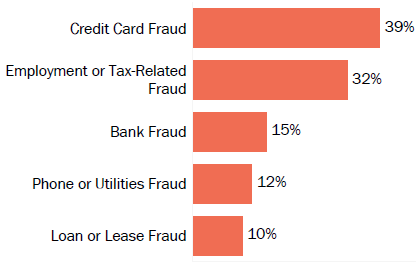
Identity Theft Reports
| State Rank (Reports per 100K Population) | 5th |
| Total Identity Theft Reports | 3,828 |
Percentages are based on the total number of relevant 2017 reports from Nevada consumers, as indicated in the chart title. This page excludes reports provided by the Nevada Attorney General. Consumers can report multiple types of identity theft.